Brief introduction
Nearly all diseases can be caused by different combinations of exposures. Yet, most epidemiological studies focus on the causal effect of a single exposure on an outcome. We present the Causes of Outcome Learning (CoOL) approach, which seeks to identify combinations of exposures (which can be interpreted causally if all causal assumptions are met) that could be responsible for an increased risk of a health outcome in population sub-groups. The approach allows for exposures acting alone and in synergy with others. We hope this approach encourages and enables epidemiologists to identify combinations of pre-outcome exposures as potential causes of the health outcome of interest
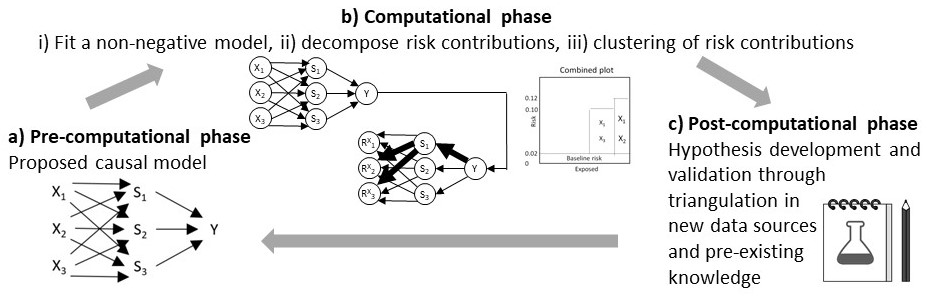
It involves (a) a pre-computational phase that proposes a causal model; (b) a computational phase with three steps, namely (i) analytically fitting a non-negative additive model, (ii) decomposing risk contributions, and (iii) clustering individuals based on the risk contributions into sub-groups based on the predefined causal model; and (c) a post-computational phase on hypothesis development and validation by triangulation on new data before eventually updating the causal model. The computational phase uses a tailored neural network for the non-negative additive model and Layer-wise Relevance Propagation for the risk decomposition through this model.
On this webpage, you find videos explaining the rational of the Causes of Outcome Learning approach and the suggested 3 phases. This webpage is also inteded to aid you through the computational phase with a tutorial implementation using the R package 'CoOL' and an interactive tool to see how the results returned by the Causes of Outcome Learning approach depends on the data generating process. We stress that this approach is an inductive-deductive approach and that researchers in each of the phases need to carefully consider the most appropriate set-up that eventually may lead to fair public health actions. The pre-print can be found at medRxiv.
R code and tutorial of the computational phase
To reproduce the motivating example from the paper using the R package, 'CoOL', (Github source code) for the computational phase:
install.packages('CoOL')
library('CoOL')
data <- CoOL_0_working_example(n=10000)
CoOL_default(data)
#See the elaborated steps in the example of:
?CoOL_0_working_example
Demonstration of the computational phase
Change the generating structure to see the results returned from the computational phase:
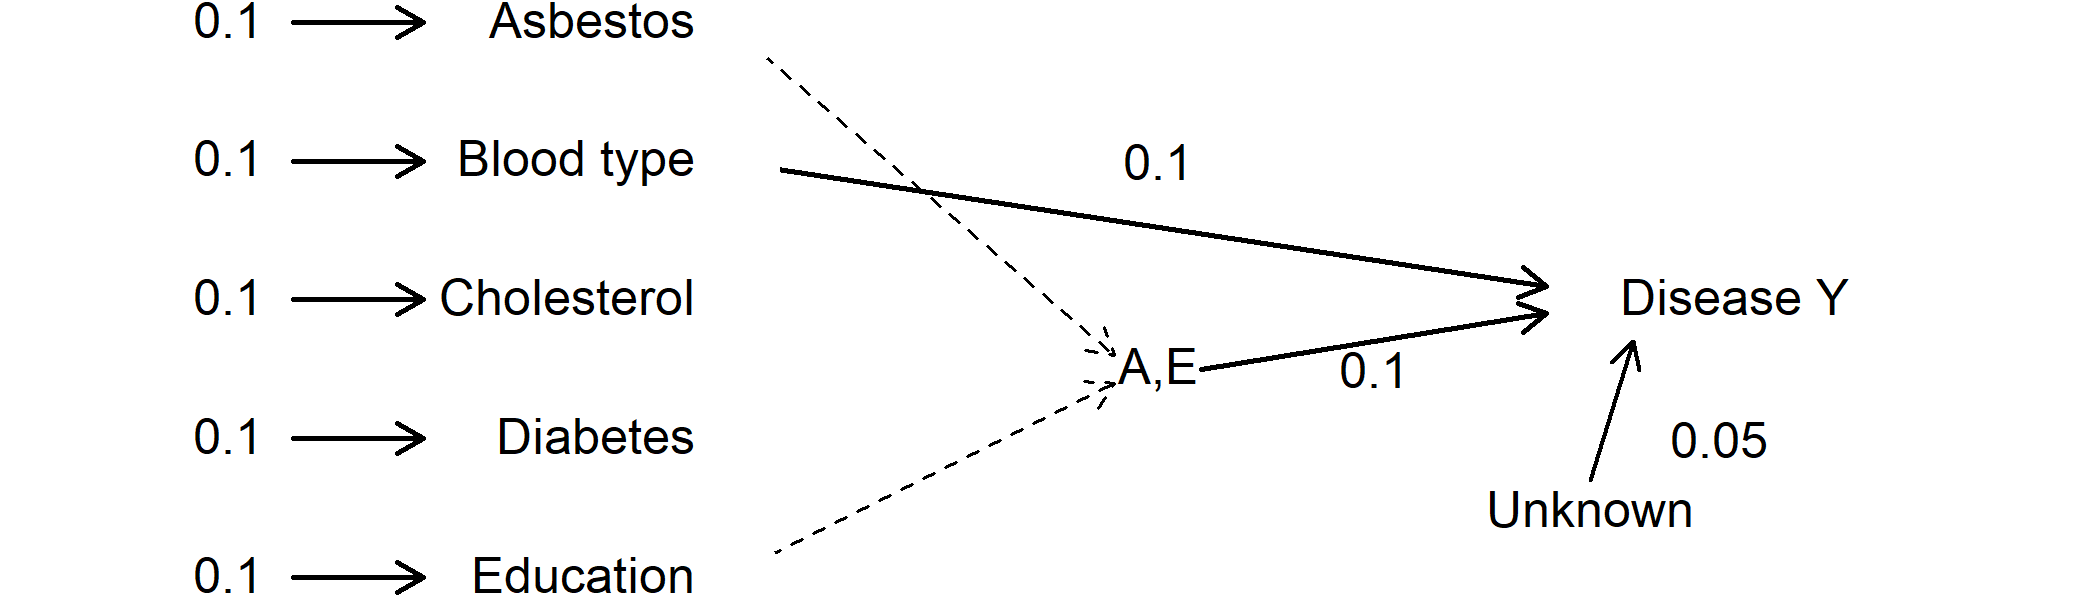
Values indicate a probability. Thus 0.1 -> Asbestos indicate that 10% of the study population is exposed to asbestos. The value 0.1 from blood type to disease Y indicate that having a specific blood type increases the risk of disease Y with 10%.
Results from the computational phase of the Causes of Outcome Learning approach will be shown below:

“n” is the total number of individuals in the sub-group. “e” is the number of events / individuals with the outcome in the subgroup. “prev” is the prevalence of the sub-group, “risk” is the mean risk in the sub-group based on the model. “excess” is the excess fraction being the proportion out of all cases which are more than expected (more than the baseline risk) in this sub-group. “obs risk” is the observed risk in this sub-group. “risk based on the sum of individual effects” is the risk summed up where all other exposures are set to zero. For the 3 estimates presented at each variable by each sub-group, the first estimate is the mean risk contribution, the estimate in parentheses is the standard deviation, and the estimate in brackets is the risk contribution had all other exposures been set to zero. The baseline risk is by definition the same for all groups.
Papers
Rieckmann, A., Dworzynski, P., Ekstrom, CT., CoOL: Causes of Outcome Learning. R package
Rieckmann, A., Nguyen, T. L., Dworzynski, P., Fisker, A. B., Rod, N. H., & Ekstroem, C. T. (2022). Machine learning models aimed at identifying risk factors for reducing morbidity and mortality still need to consider confounding related to calendar time variations. medRxiv.
Rieckmann, A. Nielsen, S., Dworzynski, P., Amini, H., Mogensen, S. W., Silva IB., Chang A. Y., Arah, O. A., Samek, W., Rod, N. H., Ekstrøm, C. T., Benn, C. S., Aaby, P., Fisker, A. B. Searching for children at consistently high risk of dying in urban Guinea-Bissau, 2003-2016: A causal discovery study. Submitted.